Beckman worked on testing their plates this week in a 50.0 mL of sulfite solution and 50.0 mL of NaOH solution. Group 1 started testing their plate (BHS-1-51). This plate had iron standard and the different ratios of 0.03 M of Cd(NO3)2 and Cu(NO3)3. The ratios of Cu:Cd is 5:1, 4:1, 3:1, and 2:1. Group 2 made an error with epoxy on one of their plates and will start testing next week. They also started epoxying another one of their plates (BHS-2-70). Group 3 started testing two of their plates (BHS-3-60) and (BHS-3-58). BHS-3-60 is a plate that is testing 0.03 M solution of iron standard and Al(NO3)3 with ratios of 2:1, 1:2, and 1:1. The BHS-3-58 plate is testing a 0.03 M of iron standard, Cd(NO3)2, Cu(NO3)3, and Al(NO3)3. The ratios of Al:Cd:Cr for this plate is 1:1:1, 1:3:1, 3:1:1, and 1:1:3. Group 4 will test their plate next week.
Canyon Crest did a short test of air-drying vs hotplate evaporation of spots (of Sr:Ba:Zn) and found that air-drying reduced the coffee ring effect. They also tested two more plates, CrCl3:K2Cr2O7:CoCl2 and K2Cr2O7:NH4VO3:KMnO4. They saw very good results in a spot with roughly equal proportions Co and Cr (which was promisingly surrounded by a gradient of high readings). One of the plates to be tested next week contains a spot similar to this so they will use that as an opportunity to confirm the result.
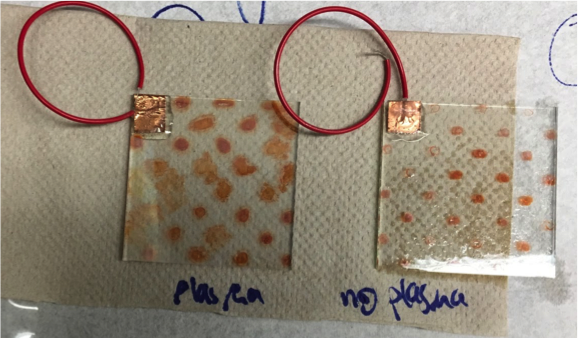
Poly finished epoxying plates of Fe(NO3)3. Tested both plates of Fe(NO3)3. One was plasma etch treated for thirty seconds before spotted. The other plate was treated normally → rinsed with acetone and isopropyl alcohol and deionized water. The Fe(NO3)3 plate treated with plasma had significantly better results than the non-treated plate, possibly due to the larger and less faded spots seen on the treated plate in comparison to the coffee-ring effect on the non-treated plate. See picture below
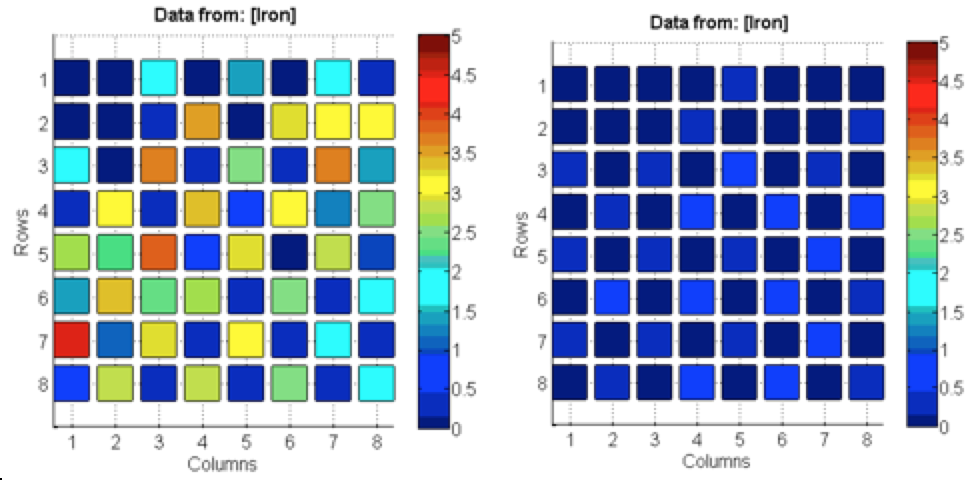
The data on the left was cleaned with an oxygen plasma and the data on the right was the control. Although these results show that there was success with the plasma cleaner, the results for the control were questionable given that they were unusually unsuccessful. Poly also looked for salts to layer with the iron and found manganese and cobalt had good band gaps. They made a 0.1 M MnSO4 solution, will make the 0.1 M cobalt solution next time.
San Marino Green Team observed last week that for spots with a higher concentration of Cu, the addition of Na2SO3 increased the relative size of the peak. They tested a new plate this week, baked at 400℉. (1) 100% Cu, Uniform dark gray; (2) 0:100 Cu:Ni, uniform pale gray; (3) 50:50 Cu:Ni, uniform dark brown; (4) 75:25 Cu:Ni, Dark yellow brown; (5) 25:75 Cu:Ni, lighter yellow brown; (6) 90:10 Cu:Ni, looks very similar to (1), uniform dark gray.
While at first, they observed that certain peaks were present in the graphs, the low overall voltage led them to the conclusion that this plate was mostly “noise”. The variation in the dark current was greater than or equal to the height of these peaks, meaning that we could not comment with any certainty on the performance of individual spots or the effect of adding Na2SO3. For next week’s plate, they have decided to continue the narrative with copper. They will once again revisit the 1:99 and 1:999 ratios, with Cu as the base material and Zn and Co as the trace materials. They will also test this plate in Na2SO3.
Blank team made a new plate (10 microliters per spot, most spots dried out before baking in kiln). Solutions used were 0.10 M NH4VO3, 0.10 M ZnSO4, 0.10 M Fe(NO3)3, 0.20 M MnCl2. Made spots with ZnSO4 + NH4VO3 (2.5:7.5), (5:5), (7.5:2.5); Fe(NO3)3 + NH4VO3 (2.5:7.5), (5:5), (7.5:2.5); MnCl2 + NH4VO3 (2.5:7.5), (5:5), (7.5:2.5); 0.1 M Fe(NO3)3; 0.2 MMnCl2; 0.1 M ZnSO4.


Recent Comments